Driver Identification Using Deep Learning
import pandas as pd  # pip install pandas
%matplotlib inline
import matplotlib.pyplot as plt # pip install matplotlib
#import seaborn as sns; sns.set()  # for plot styling
import numpy as np

data=pd.read_csv('full_data_test.csv')

columns2=["Long_Term_Fuel_Trim_Bank1","Intake_air_pressure","Accelerator_Pedal_value","Fuel_consumption","Torque_of_friction","Maximum_indicated_engine_torque","Engine_torque","Calculated_LOAD_value",
"Activation_of_Air_compressor","Engine_coolant_temperature","Transmission_oil_temperature","Wheel_velocity_front_left-hand","Wheel_velocity_front_right-hand","Wheel_velocity_rear_left-hand",
"Torque_converter_speed"]

#The anomalie detector using the One-Class Support Vector Machine

from sklearn import svm
ano_det = svm.OneClassSVM(nu=0.1, kernel="rbf", gamma=0.1) # nu is upper bound, gamma  , kernal coeffient of rbf (), 1 / (n_features * X.var()) as value of gamma
ano_det.fit(data[columns2])
OneClassSVM(cache_size=200, coef0=0.0, degree=3, gamma=0.1, kernel=’rbf’,
max_iter=-1, nu=0.1, random_state=None, shrinking=True, tol=0.001,
verbose=False)
Preprocessing Of The Data
classes=['A','B','C','D','E','F','G','H','I','J']


drivers =[]
for c in classes:
    drivers.append(data[data['Class']==c])
dataa=[]
for c in range(len(drivers)):
    nt=0
    nv=0
    drivers[c]=drivers[c].reset_index(drop=True)
    idxs=drivers[c][drivers[c]['Time(s)']==1].index.values
    for i in range(len(idxs)):
        if i <(len(idxs)-1):
            nt=nt+1
            dataa.append(drivers[c][idxs[i]:idxs[i+1]])
        if i==(len(idxs)-1):
            nv=nv+1
            dataa.append(drivers[c][idxs[i]:])
    print("Driver : "+str(c)+" number of trips :"+str(len(idxs))+ "  For Train : "+str(nt)+"  For valid :"+str(nv))


drivers=[]
ss=0
for i in range(len(dataa)):
    #print(n)
    n=int(len(dataa[i])/60)
    #print(" Drive "+str(i)+" contains "+str(n)+" subdriversets")
    dd=0
    for j in range(n):
        #print(j)
        temp=dataa[i][dd:dd+60]
        temp=temp.reset_index(drop=True)
        drivers.append(temp)
        ss=ss+1
        dd=dd+60
print("total is "+str(ss))


samples = list()
labels=list()
from sklearn.preprocessing import StandardScaler
scaler = StandardScaler()
scaler.fit(data[columns2].values)
for c in drivers:
    labels.append(c['Class'][0])
    del c['Class']
    del c['Time(s)']
    samples.append(scaler.transform(c[columns2].values))
data = np.array(samples)
print(data.shape)
data.shape
(1551, 60, 15)
from sklearn import preprocessing
le = p(1551, 60, 15)reprocessing.LabelEncoder()
le.fit(labels)
labels=le.transform(labels)
from keras import optimizers
# Doing the cross validation and training the model
from sklearn.model_selection import train_test_split
X_train, X_test, y_train, y_test = train_test_split(data, labels, test_size=0.3, random_state=31)
X_test, X_predict, y_test, y_predict = train_test_split(X_test, y_test, test_size=0.1, random_state=31)
Using TensorFlow backend.
X_train.shape
(1085, 60, 15)
X_test.shape
(419, 60, 15)
X_predict.shape
(47, 60, 15)
data.shape[1]
60
data.shape[2]
15Implement FCN-LSTM
from keras.models import Sequential
from keras.layers import Dense
from keras.layers import *

from keras.models import Model
from keras.layers import Input, PReLU, Dense, LSTM, multiply, concatenate, Activation
from keras.layers import Conv1D, BatchNormalization, GlobalAveragePooling1D, Permute, Dropout
from keras.callbacks import ModelCheckpoint
from tensorflow import keras
from tensorflow.keras import layers


ip = Input(shape=(data.shape[1], data.shape[2]))

x = Permute((2, 1))(ip) # dimension shuffle
x=LSTM(10)(x)
x = Dropout(0.8)(x)


y = Conv1D(128, 8, padding='same', kernel_initializer='he_uniform')(ip)
y = BatchNormalization()(y)
y = Activation('relu')(y)
y = Conv1D(256, 5, padding='same', kernel_initializer='he_uniform')(y)
y = BatchNormalization()(y)
y = Activation('relu')(y)
y = Conv1D(128, 3, padding='same', kernel_initializer='he_uniform')(y)
y = BatchNormalization()(y)
y = Activation('relu')(y)
y = GlobalAveragePooling1D()(y)

x = concatenate([x, y])
out = Dense(10, activation='sigmoid')(y)
model = Model(ip, out)
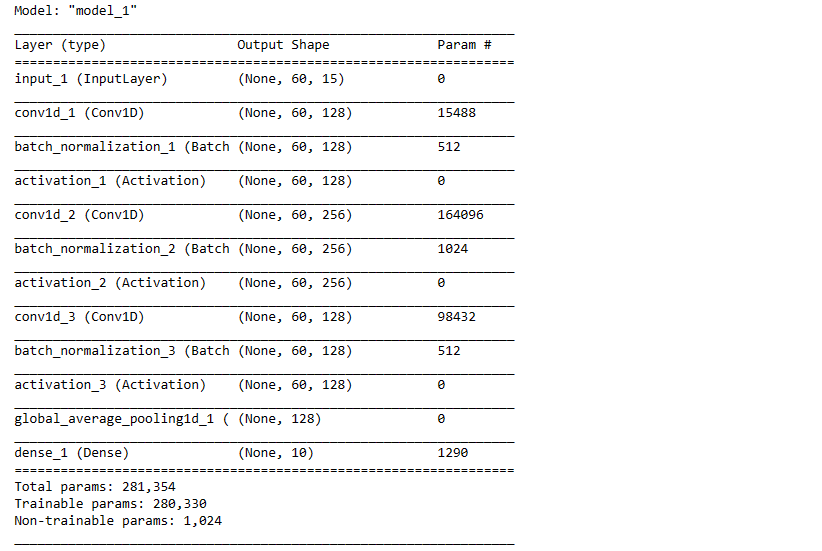
model.summary()

Train The Model
model.compile(loss='sparse_categorical_crossentropy', optimizer='adam', metrics=['accuracy'])
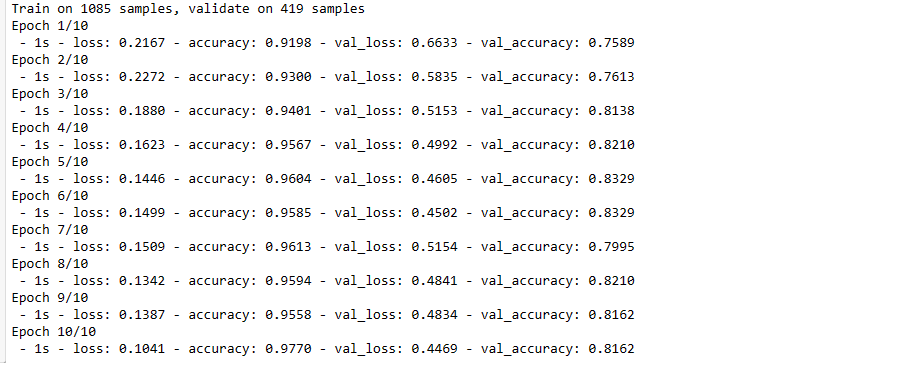
history = model.fit(X_train, y_train, validation_data=(X_test,y_test), epochs=10, batch_size=128, verbose=2)
model.save('Driver_Profiling.h5')
model.evaluate(X_test, y_test)
419/419 [==============================] - 0s 257us/step
[0.4469447733394286, 0.8162291049957275]
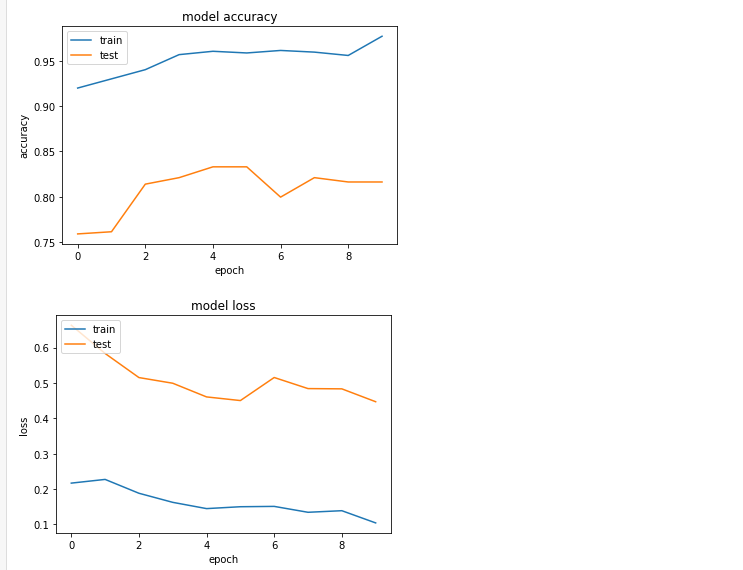
print(history.history.keys())
# summarize history for accuracy
plt.plot(history.history['accuracy'])
plt.plot(history.history['val_accuracy'])
plt.title('model accuracy')
plt.ylabel('accuracy')
plt.xlabel('epoch')
plt.legend(['train', 'test'], loc='upper left')
plt.show()
# summarize history for loss
plt.plot(history.history['loss'])
plt.plot(history.history['val_loss'])
plt.title('model loss')
plt.ylabel('loss')
plt.xlabel('epoch')
plt.legend(['train', 'test'], loc='upper left')
plt.show()
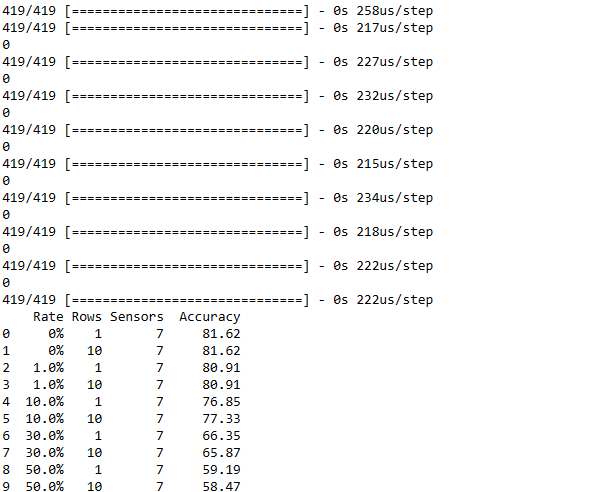
 #Adding some anomalies to the data to test the performance of the model
import random
rates=[0,0.01,0.1,0.3,0.5]
rows=[1,10]
sensors=[7]

results=pd.DataFrame(columns=["Rate","Rows","Sensors","Accuracy"])
for rate in rates:
      for row in rows:
        for sensor in sensors:
            X_test2=X_test.copy()
            total=X_test.shape[0]*X_test.shape[1]*X_test.shape[2]
            total=int(311*rate)
            n=sensor
            nrows=row
            for i in range(total):
                if(i%10000==0):
                    print(i)
                fst=random.randint(0,X_test.shape[0]-1)
                snd=random.randint(0,X_test.shape[1]-nrows)
                trh2=random.sample(range(0, X_test.shape[2]), n)
                for j in range(n):
                    for jj in range(nrows):
                        X_test2[fst][snd+jj][trh2[j]]=X_test2[fst][snd+jj][trh2[j]]+3000
            acc=round(model.evaluate(X_test2, y_test)[1]*100,2)
            results = results.append({'Rate': str(rate*100)+"%",'Rows': str(row)+"",'Sensors': str(sensor)+"",'Accuracy': acc}, ignore_index=True)
    #model.evaluate(X_test2, y_test)


print(results)
Development Part
model = keras.models.load_model('Driver_Profiling.h5')
Live_Data= np.expand_dims(X_predict[10],axis=0)
X_predict[1].shape
(60, 15)
Live_Data.shape
(1, 60, 15)
pred = model.predict(Live_Data)
pred # by mymodel
array([[3.1590462e-06, 8.9406967e-08, 5.6922436e-06, 1.9669533e-06,
3.5762787e-07, 7.7105701e-02, 3.3289194e-05, 1.0073185e-05,
1.6161976e-05, 3.5859044e-05]], dtype=float32)
np.argmax(pred)# by mymodel
5
y_predict[10] # stored value / actual values
5
y_predict
array([1, 0, 3, 4, 6, 4, 3, 1, 9, 5, 5, 8, 9, 4, 1, 3, 0, 1, 6, 7, 1, 3,
9, 8, 2, 6, 8, 3, 5, 1, 3, 1, 7, 3, 5, 7, 5, 1, 1, 6, 9, 0, 2, 0,
1, 3, 6], dtype=int64)
